Swayam Academy
Helping You To Trade Smartly
Swayam Academy , 403-C , Fourth Floor , Richmond Plaza
Richmond Circle , Opp To Employee Provident Fund Office
Bengaluru, Karnataka 560 028
India
ph: 08041212385
feedback
- Home
- Training Pictures
- Training Programs Offered By Us
- Organisation Introduction
- Technical Analysis
- W D Gann Angle Theory
- Gann Price Vs Time Squaring - Finding Support & Resistance
- Gann Squaring High & Low - Predicting Future High & Low Dates
- Gann Dates & Market Moment
- Gann Swing Analysis
- Gann Astrononamy
- Gann Astrononamy - Zodiac & Houses
- Gann Astrononamy - Planetary Aspect & Market Outcome
- Gann Astrononamy - Individual Birth Chart & Trading
- Gann Astrononamy - Companies Birth Chart & Trading
- Gann Astrononanmy - Trading On Index Based On Planetary Positions
- Fibonacci
- Elliot Wave Theory
- Dow Theory
- The Charts
- Japanese Candlestick Pattern
- Single Candlestick Patterns
- Bearish Double-Stick Candle Patterns
- Bearish Three-Stick Candle Pattern
- Bullish Double-Stick Candle Patterns
- Bullish Three-Stick Candle Pattern
- Fundamental Analysis
- Trading Tools & Software
- NCFM Courses
- Contact Us
Fibonacci History
Historical evidence states that this pattern was first discovered by ancient Indian saint “ Pingalacharya” in 200 BC. He passed this knowledge verbally to his disciples. The clearest exposition of the series arises in the work of Virahanka (c. 700AD) . This was picked by Arabs and published in Arabic.
In the West, the Fibonacci sequence first appears in the book Liber Abaci (1202) by Leonardo of Pisa, known as Fibonacci.This sequence got its name from this Italian Mathematician.
The first 21 Fibonacci numbers Fn for n = 0, 1, 2, ..., 20 are:
F0 | F1 | F2 | F3 | F4 | F5 | F6 | F7 | F8 | F9 | F10 | F11 | F12 | F13 | F14 | F15 | F16 | F17 | F18 | F19 | F20 |
0 | 1 | 1 | 2 | 3 | 5 | 8 | 13 | 21 | 34 | 55 | 89 | 144 | 233 | 377 | 610 | 987 | 1597 | 2584 | 4181 | 6765 |
The sum of two consecutive numbers equals the next number. The ratio of any number to its next highest number approaches 0.618. The ration of alternating numbers approaches 0.382. Also , 1-0.618 = 0.382. The midpoint of 0.382 and 0.618 is 0.50. This is why 0.382, 0.50 and 0.618 are used.
Fibonacci Retracements
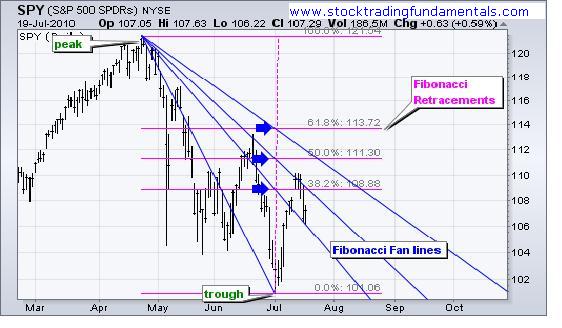
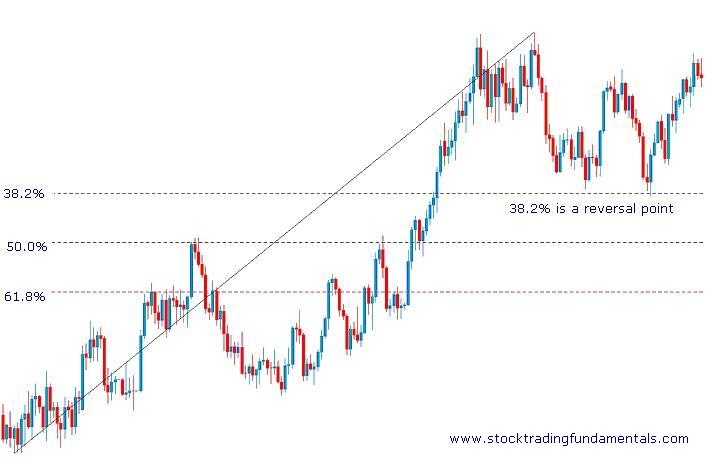
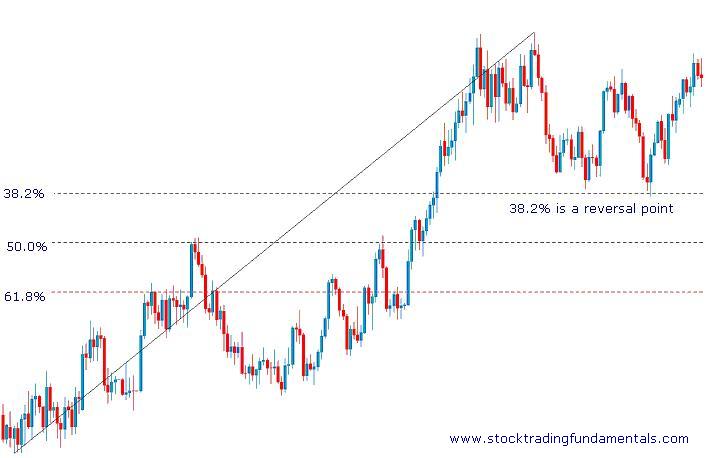
In technical analysis, Fibonacci retracements approximate support and resistance (and potential turning points) following a trend. Calculate the distance from the low to the high of the trend and calculate 38.2%, 50%, and 61.8% of the distance of the trend. Subtract those values from the top of the trend. Those are the potential reversal points. Charting packages perform the calculations for you - all you have to do is connect the low of the trend with the high of the trend using the Fibonacci retracement tool.
Fibonacci Arc
Following an uptrend, Fibonacci arcs use a line that connects the low and high of the trend - but the line is drawn from high to low (not low to high as in retracements). Three curves that intersect the trendline (drawn from high to low) at the retracement levels of 38.2%, 50% and 61.8% are the Fibonacci arcs. The arcs are also estimations for support.
Fibonacci Fan
Fibonacci fans are composed of diagonal lines. After the high and low of the chart is located, an invisible vertical line is drawn though the rightmost point. This invisible line is then divided into 38.2%, 50% and 61.8%, and lines are drawn from the leftmost point through each of these points. These lines indicate areas of support and resistance.

Fibonacci Time Zone
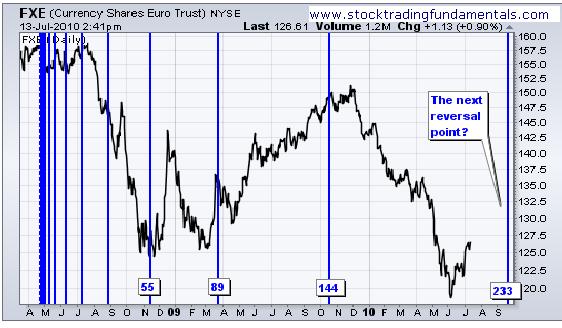
Unlike the other Fibonacci methods, time zones are a series of vertical lines. They are composed by dividing a chart into segments with vertical lines spaced apart in increments that conform to the Fibonacci sequence (1, 1, 2, 3, 5, 8, 13, etc.). These lines indicate areas in which major price movement can be expected.

Copyright 2011 Stock Trading Fundamentals. All rights reserved.
Swayam Academy , 403-C , Fourth Floor , Richmond Plaza
Richmond Circle , Opp To Employee Provident Fund Office
Bengaluru, Karnataka 560 028
India
ph: 08041212385
feedback


