Swayam Academy
Helping You To Trade Smartly
Swayam Academy , 403-C , Fourth Floor , Richmond Plaza
Richmond Circle , Opp To Employee Provident Fund Office
Bengaluru, Karnataka 560 028
India
ph: 08041212385
feedback
W D Gann Angle Theory
W D Gann Technical Analysis Wizard
 William D. Gann (1878 to 1955) was an outstanding technical analyst. He was born on a cotton ranch on June 6, 1878, in Lufkin, Texas. Gann claimed to have made a world’s record in leverage and accuracy more than once, that he had developed trading strategies for speculators, and that he could predict market moves to the exact price level. Consider using this space to introduce your page. Just click to add your own content. He displayed a strong aptitude in mathematics during his early years, completed a high-school education, and started trading in 1902 at the age of 24. By his own admission, Gann’s early trading was based on “hope, fear and greed,” all of which he later realized were not compatible with a successful trading strategy. After losing significant sum of money, Gann began to observe that markets followed mathematical laws and certain time cycles. He was particularly interested in the connection between price and time, a relationship he referred to as the “square” of price and time. He began studying this interaction diligently, even traveling to England, India, and Egypt to research mathematical theory and historical prices.
In developing his theories, Gann was undoubtedly one of the most industrious technical analysts. He made thousands of charts displaying daily, weekly, monthly, and yearly prices for a wide variety of stocks and commodities. He was a avid researcher, occasionally charting a price back hundreds of years. At a time when most market analysis was strictly fundamental, Gann’s revolutionary theories relied on natural laws of mathematics, time cycles, and his unshakable conviction that past market activity predicted future activity .
W D Gann's Law Of Vibration
Gann in his Stock Market Courses have explicitly proved that all stocks and commodities vibrate. He named it as " W D Gann's Law Of Vibration " in that he says that if we can calculate the rate of vibration then its is possible to predict the future price moment of the asset. The principle of Gann Angle Theory is based on this concept only.
Gann Price Vs Time Square & Gann Angle
The squaring of price and time was one of the most important and valuable discoveries that Gann ever made. In his trading course he stated “ if you stick strictly to the rule, and always watch when price is squared by time, or when time and price come together, you will be able to forecast the important changes in trend with greater accuracy”.
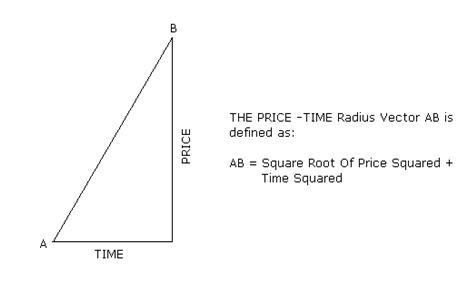 The squaring of price with time means an equal number of points up or down, balancing an equal number of time periods- either days, weeks, or months. Gann suggested traders square the range, low prices, and high prices.
Gann has plotted the relationship between price and time. He explicitly stated that at the point of intersection between the price and time trend line there is a valid reason for a expectation of change in trend. Gann has given 11 different trend lines which will guide the trader in taking timely wise decision. These trend lines are drawn based on the geometrical angle proportion in X and Y axis.


The most important trend line 1X1 (read it “one by one” ) Gann angle. This is a straight line drawn in the price-time chart which makes and angle 45° with the X-Axis. i.e. This is the trend line drawn assuming 1 unit of price change with respect to 1 unit of time change in a semi log scale. Similarly 2X1 ( two by one) trend line means line is drawn assuming the 2 unit of price rise or fall happens in 1 unit of time. This trend line makes geometrical angle of 63.75° with X Axis when drawn from a lower price point and projected toward higher price points. Similarly this trend line will make 26.25° with respect respect to X-Axis when it is drawn from a higher price point and projected towards the lower price point.
Gann Wheel
Gann was always emphasizing in his training courses that a trader should keep to the rules and watch for when the price is squared by time or when price and time come together and the trader will be able to forecast the major trend changes with unbelievable accuracy, especially when using the Gann wheel or the square of nine as illustrated below.
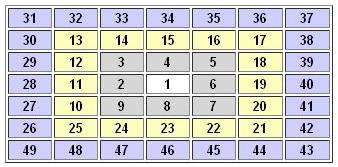 The Gann wheel is recognized by most people as the Square of Nine or a Square Root calculator. As you can see from the illustration it is a few rings of a Gann wheel with the number 1 at the center. You will have to visualize a circle to understand that the number 19 is 90 degrees from the number 15 or that the number 8 is 180 degrees from the number 46.
What Gann says is that we know that the square root of 15 is 3.87 and that we add 2 to the square root of 15 we get the number 5.87. If we square 5.87 we get 34. So if we add 2 to the square root of a number and then squaring that number, it is the same thing as one 360 degree rotation on the Gann wheel. So if 2 represents a 360 degree rotation then 1 must represent a 180 degree rotation and 0.5 is a 90 degree rotation. It’s the 90 degree that Gann claimed was very important in the markets. He was saying that adding and subtracting 0.5 or exact multiples of .5 to the square root of a stock price and then squaring the result is significant. As we know 90 degrees is also very prominent in astrology and maybe Gann was influenced by heavenly events too.
What is unique aspect about the Square of Nine is that it completely unconcerned whether the variables are a range of prices, one particular price, or a number of stock trading days, for example. For the Square of Nine they are identical and totally exchangeable. For a trader who has been brought up on charts, moving averages and oscillators the concept of squares, circles and square roots can be a little daunting and maybe a little mystifying.

Swayam Academy , 403-C , Fourth Floor , Richmond Plaza
Richmond Circle , Opp To Employee Provident Fund Office
Bengaluru, Karnataka 560 028
India
ph: 08041212385
feedback