Swayam Academy
Helping You To Trade Smartly
Swayam Academy , 403-C , Fourth Floor , Richmond Plaza
Richmond Circle , Opp To Employee Provident Fund Office
Bengaluru, Karnataka 560 028
India
ph: 08041212385
feedback
Gann Price Vs Time Squaring - Finding
Support & Resistance
Gann says that there can be nine mathematical proofs of any point of resistance
- Angles from top and bottoms.
- Angles running horizontally i.e. the previous tops and bottoms.
- Time cycles. (vertical angles) e.g. if there are three or four days of sideways moment after a high day and this is followed by a down day with high volume where low is lower that the lows by sideways moment and when this coincides with expiry of time cycle)
- Crossing of important angle originating at Zero.
- Crossing of coming together of angles from double or triple tops or bottoms.
- Crossing of double or triple tops or bottoms.
- Past resistance/support
- Volume of sales
- Squaring of time and price.
Support = (√High-Degree Factor)²
Resistance = (√Low+Degree Factor)²
Practical Example Of Deriving Support & Resistance
- SBI on 11th Nov' 2010On 11th November 2010 SBI between 9.15 A.M. to 9.30 A.M. made high 3238.35 at 9.16 P.M. Low 3214.10 at 9:27 P.M
We have derived the above scrip’s support and resistance using SQUARER 2012 SOFTWARE - PRICE VS TIME SQUARING TECHNIQUE

As per the above data we are advised to buy the scrip at 3223.55 or sell at 3228.873. In that case we need to do recalculation. Here instead of calculating from high and low point we will start calculating from mid point.
The modified calculation table is as follows.
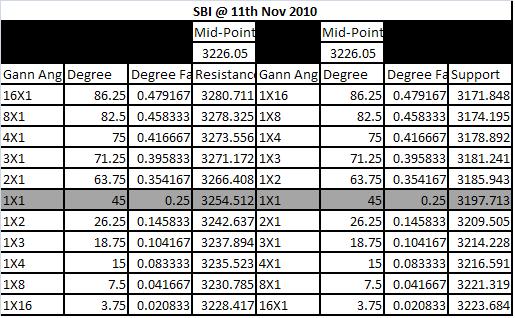
As per this we are advised to buy at 3235.52 for a final target of 3280.71 and sell at 3216.59 for a final target of 3172.0214.
Trade Outcome :
At 9:34 A.M we got a chance to sell at 3217 and kept a stop loss at 3235.52 as per our above table. On achieving first target of 3214.22 we have moved our stop loss to 3216.59, then upon crossing the second stop loss we altered the stop loss to 3214.4. After touching the low of 3211 at 9:39 A.M scrip rebounded and hit our stop loss of 3214.4 . We got 3 points in this experiment.
Again we will wait for our next entry point. On crossing 3235.52 at 10:07 A.M we can go for a buy with a target of 3280.71 and stop loss of 3216.59. The scrip got to 3254 at 11:27 A.M which is a 45° angle. People who are waiting for a strong conformation can enter at this level also by keeping a stop loss of 3235.52
Swayam Academy , 403-C , Fourth Floor , Richmond Plaza
Richmond Circle , Opp To Employee Provident Fund Office
Bengaluru, Karnataka 560 028
India
ph: 08041212385
feedback