Swayam Academy

Helping You To Trade Smartly

Swayam Academy , 403-C , Fourth Floor , Richmond Plaza
Richmond Circle , Opp To Employee Provident Fund Office
Bengaluru, Karnataka 560 028
India

ph: 08041212385

feedback@stocktradingfundamentals.com

  • Home
  • Training Pictures
  • Training Programs Offered By Us
  • Organisation Introduction
    • Promotor Profile
    • Story Behind Venture
  • Technical Analysis
    • W D Gann Angle Theory
    • Gann Price Vs Time Squaring - Finding Support & Resistance
    • Gann Squaring High & Low - Predicting Future High & Low Dates
    • Gann Dates & Market Moment
    • Gann Swing Analysis
    • Gann Astrononamy
    • Gann Astrononamy - Zodiac & Houses
    • Gann Astrononamy - Planetary Aspect & Market Outcome
    • Gann Astrononamy - Individual Birth Chart & Trading
    • Gann Astrononamy - Companies Birth Chart & Trading
    • Gann Astrononanmy - Trading On Index Based On Planetary Positions
    • Fibonacci
    • Elliot Wave Theory
    • Dow Theory
    • The Charts
    • Japanese Candlestick Pattern
    • Single Candlestick Patterns
    • Bearish Double-Stick Candle Patterns
    • Bearish Three-Stick Candle Pattern
    • Bullish Double-Stick Candle Patterns
    • Bullish Three-Stick Candle Pattern
  • Fundamental Analysis
    • Why Invest In Equity ?
    • Economic Analysis
    • Ratio Analysis
  • Trading Tools & Software
  • NCFM Courses
  • Contact Us

Gann Swing Analysis

Upswing

In a downward trending market after a continuous downward trending days , there is a indication of market trend change with two days of upward trend i.e. the pivot is broken . The upward swing is confirmed but market trend is still downward. 


Downswing

In a upward trending market after a continuous upward trending days , there is a indication of market trend change with two days of downward trend i.e. the pivot is broken . The downward swing is confirmed but market trend is still upward.
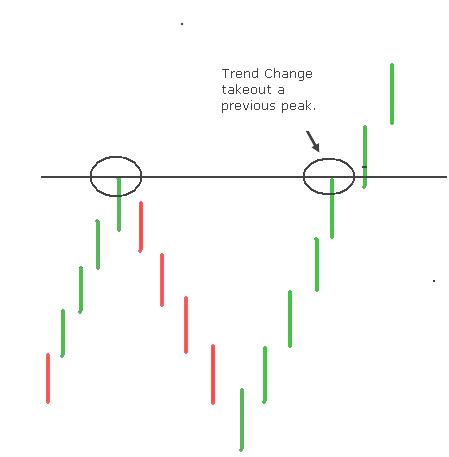


Uptrend

Trend change is when the previous peak is taken out. As shown in the picture below. 

Downtrend

Previous lows are broken shows a clear trend change.


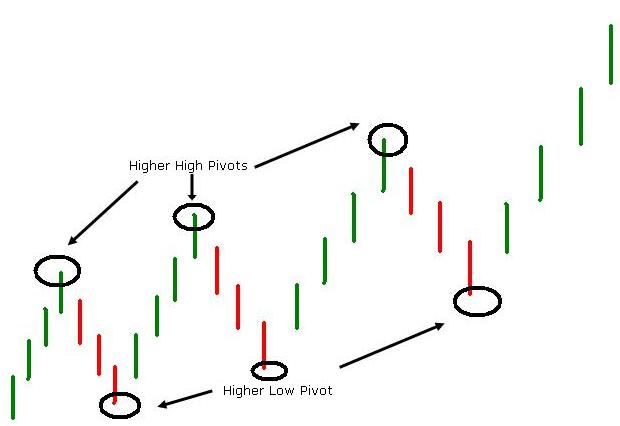
Uptrend – Higher High Pivot and Higher Low Pivot.


Downtrend = Lower Low Pivots + Lower Highs Pivots


Sideways = Pivots within the range of previous highs and lows


    Copyright 2011 Stock Trading Fundamentals. All rights reserved.

    Web Hosting by Yahoo!

    Swayam Academy , 403-C , Fourth Floor , Richmond Plaza
    Richmond Circle , Opp To Employee Provident Fund Office
    Bengaluru, Karnataka 560 028
    India

    ph: 08041212385

    feedback@stocktradingfundamentals.com