Swayam Academy

Helping You To Trade Smartly

Swayam Academy , 403-C , Fourth Floor , Richmond Plaza
Richmond Circle , Opp To Employee Provident Fund Office
Bengaluru, Karnataka 560 028
India

ph: 08041212385

feedback@stocktradingfundamentals.com

  • Home
  • Training Pictures
  • Training Programs Offered By Us
  • Organisation Introduction
    • Promotor Profile
    • Story Behind Venture
  • Technical Analysis
    • W D Gann Angle Theory
    • Gann Price Vs Time Squaring - Finding Support & Resistance
    • Gann Squaring High & Low - Predicting Future High & Low Dates
    • Gann Dates & Market Moment
    • Gann Swing Analysis
    • Gann Astrononamy
    • Gann Astrononamy - Zodiac & Houses
    • Gann Astrononamy - Planetary Aspect & Market Outcome
    • Gann Astrononamy - Individual Birth Chart & Trading
    • Gann Astrononamy - Companies Birth Chart & Trading
    • Gann Astrononanmy - Trading On Index Based On Planetary Positions
    • Fibonacci
    • Elliot Wave Theory
    • Dow Theory
    • The Charts
    • Japanese Candlestick Pattern
    • Single Candlestick Patterns
    • Bearish Double-Stick Candle Patterns
    • Bearish Three-Stick Candle Pattern
    • Bullish Double-Stick Candle Patterns
    • Bullish Three-Stick Candle Pattern
  • Fundamental Analysis
    • Why Invest In Equity ?
    • Economic Analysis
    • Ratio Analysis
  • Trading Tools & Software
  • NCFM Courses
  • Contact Us

Economic Analysis

Share Market dose not operate in vacuum . Its a integral part of whole economy of county.

                                     
  • To gain insight into the complexity of share market investor need to develop a sound economic understanding to interpret various macroeconomic indicators which can be Procyclic, Counter cyclic, Acyclic .

  • Different Economic Indicators are
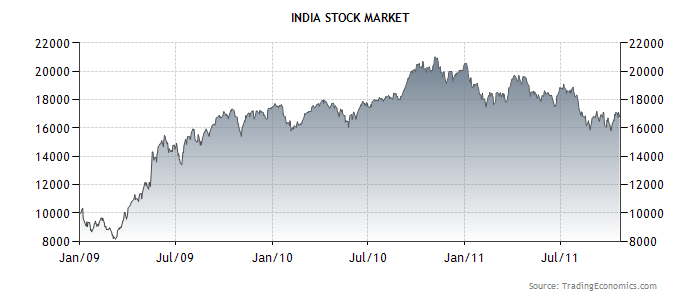

  • Gross Domestic Product

    • GDP Vs GNP
    • Nominal GDP & Real GDP
  • Inflation
       

  • Monitory Policies

  • Stock Market

  • Foreign Investment - FDI & FII
  • Industrial Production Numbers


  • Balance Of Trade Performance


  • Business Confidence Index


  • Consumer Confidence Index

  • Current Account Deficit

  • Current Account To GDP


  • Exports


  • Government 10Year Bond Moment

  • Government Budget Deficit 

  • Government Debt to GDP

  • Imports


  • The above indicators can be a Leading, Lagged or Coincident factors for share market performance.


Copyright 2011 Stock Trading Fundamentals. All rights reserved.

Web Hosting by Yahoo!

Swayam Academy , 403-C , Fourth Floor , Richmond Plaza
Richmond Circle , Opp To Employee Provident Fund Office
Bengaluru, Karnataka 560 028
India

ph: 08041212385

feedback@stocktradingfundamentals.com